The relationship between customer reviews and Customer Lifetime Value (CLV) is positive; data analysis of 4 million transactions reveals that higher review scores, especially 5-star ratings, correlate with a significant lift in long-term revenue. While the influence of review scores is strongest for first-time buyers, improving ratings by 10% across all cohorts can lead to a 4.6% lift in total revenue. Consistent collection and analysis of customer feedback are essential for measuring experience and driving sustainable business growth.
How was the customer review and CLV analysis conducted?
We define Customer Lifetime Value as the monetary amount spent 1 year after said purchase, aligning with HubSpot's methodologies for calculating CLV. Whilst all customers were invited to review the purchase experience, only 10% did. The reviewers were thus self-selected, which in theory could bias the review scores either upwards or downwards.
Therefore, we included as a cohort those reviewers that did not leave a review for a full comparison. We divided the remaining (i.e., those customers who did leave a review) into cohorts based on the number of previous purchases (purchase history) and their review score, 1-5. We grouped previous purchasers into groups of 0, 1, 2, 3, and 4+ previous purchases, and the review score grouped 1-5 and no review given. This produces a cohort matrix of 5x6. The number of prior purchases tends to strongly influence the CLV, as we have written about here.
How does cohort attribution work for customer reviews?
Cohort attribution, a concept thoroughly detailed in CleverTap's guide to cohort analysis, is calculated based on the sliding window of the previous and next 12-month customer activity. Let’s see some examples.
Customer Activity by events
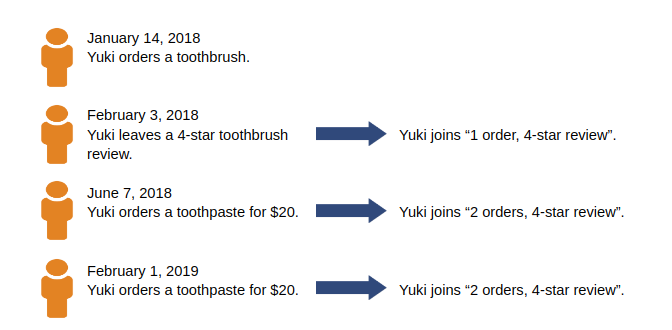
The first and 2nd events are combined into 1 cohort as review happens just after the purchase event. If there would be no review after 1st purchase in the next 12 months, then the cohort would be “1 order, no-review”.
Now let’s calculate CLV for each cohort:
Cohort 1 order, 4-star reviews CLV=$40
Cohort 2 order, 4-star reviews CLV=$20
...
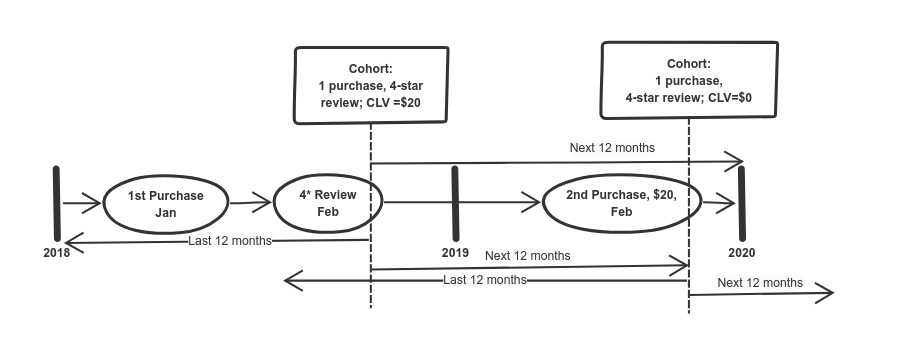
Once we calculate each cohort, we add them together over time to calculate the mean CLV. The same customer can be included multiple times to the same cohort if he makes more purchases in the future. In our example, we get the same cohort from February 1, 2019, as if from June 7, 2018, as the last 12 month events match. In this way, we evaluate each new event as a new cohort by sliding forward in time. This can be visualized by looking at the timeline below.
Now that we have defined and illustrated cohorts, let’s look at what the data tells us.
How to interpret the impact of customer reviews on CLV?
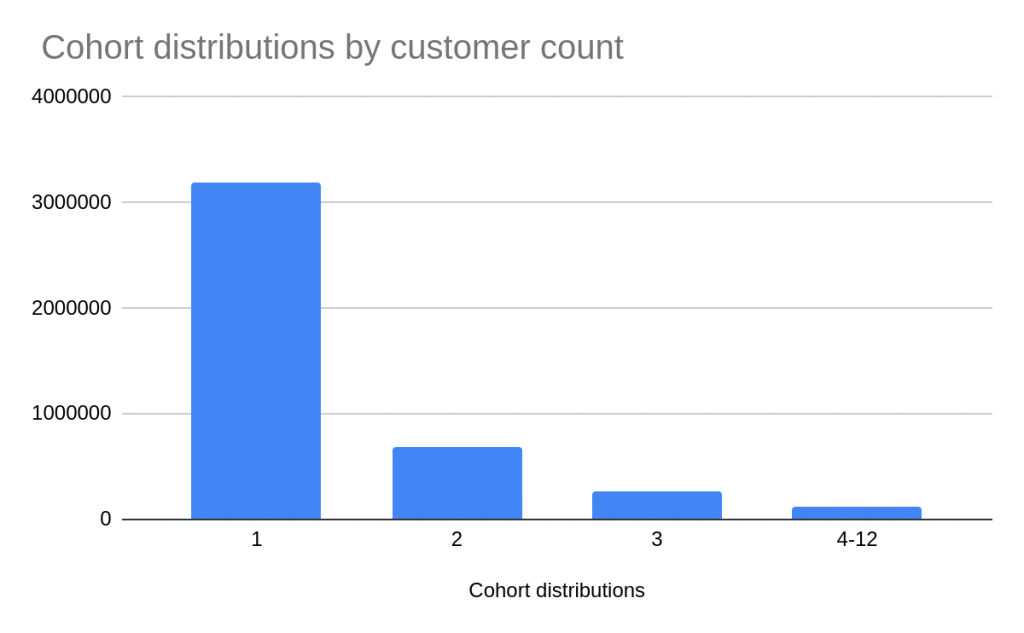
Cohort distributions show how customer count is distributed among all cohorts. We can see that around 80% of the customers make a single purchase within 12 months.
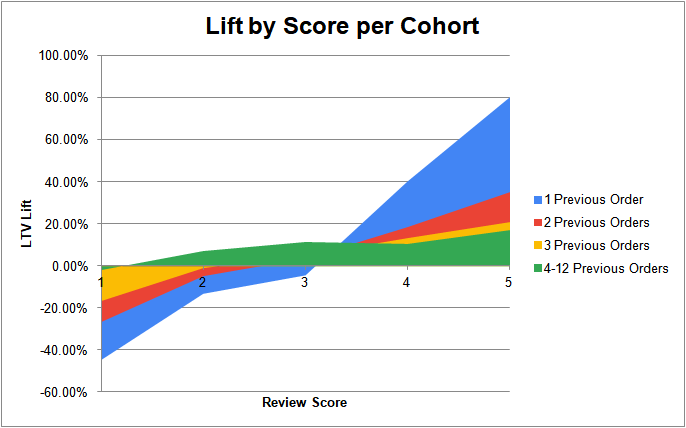
In the above chart, we can see that the review rating has the most significant impact on first-time buyers, corroborating Spiegel Research Center's findings on how online reviews influence sales. The 5-star rating has 80% higher CLV’s than customers that haven’t left any review (our control group with average CLV). From cohort distribution, we can say that rating has a significant influence on first-time buyers, and that also impacts the bottom line of the business, which we will see later.
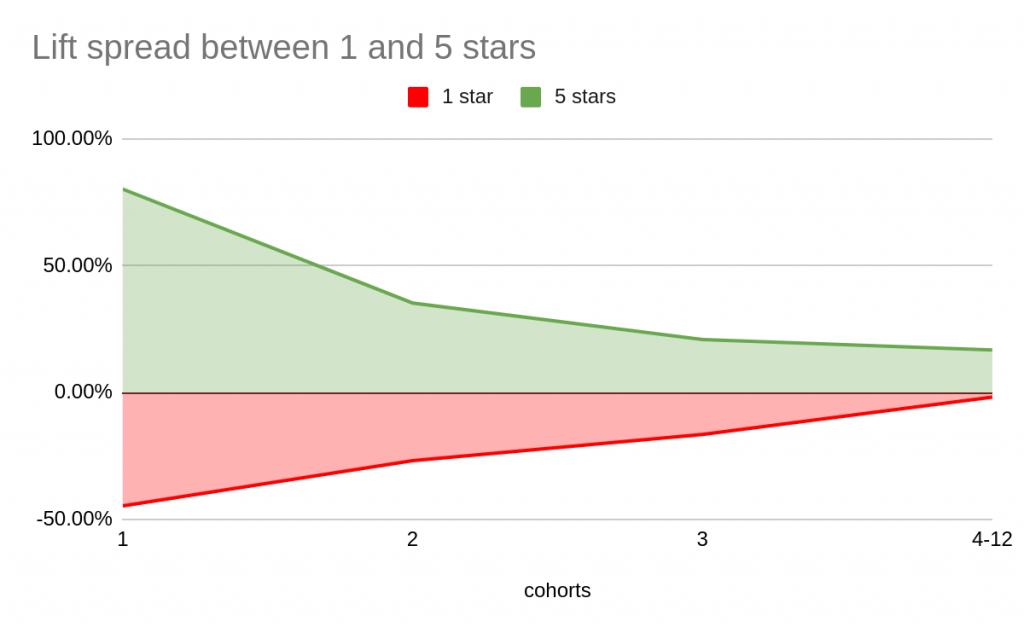
It's also useful to see rating influence when comparing the worst and best ratings between different cohorts. The above shows us that spread between ratings narrows significantly with each additional purchase by the customer. This finding explains why frequency has such a predictive power for future purchases (we discuss in more detail in the following article) while rating has less influence.
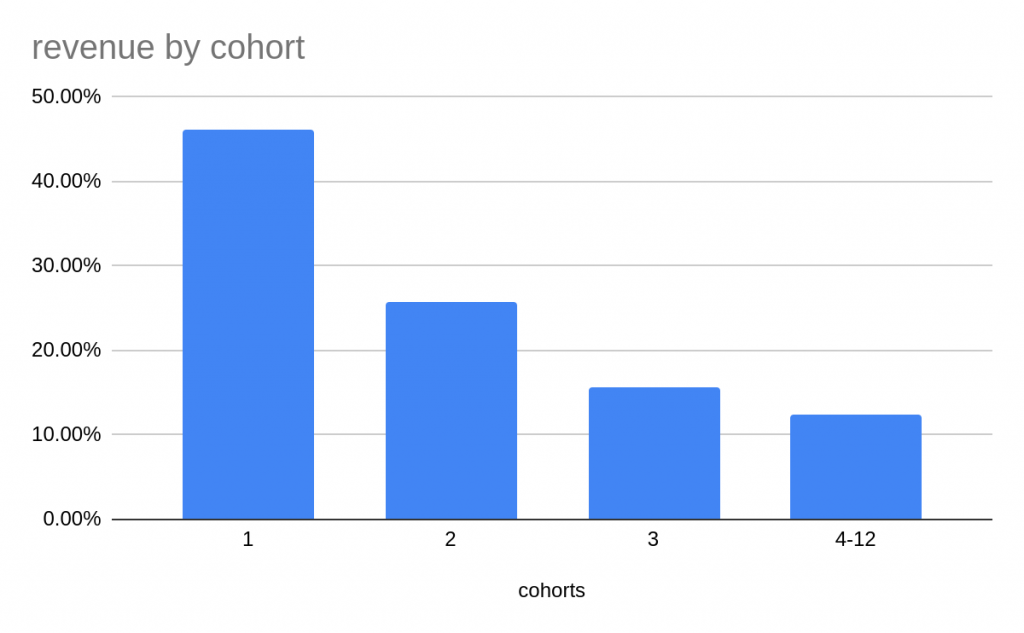
To compare the impact of review rating changes on the bottom line, we need to compare what each cohort generates in terms of revenue. Even though the 1st time buyers are the most significant cohort, it generates less than 50% of total revenue. Note that we don’t account for acquisition costs, which tend to be higher for first-time buyers.
The interesting question is if we would improve our rating scores by 10% on all of our cohorts, how much extra revenue would that generate for our case study business? For this to determine we have to do some simple calculation as follows:
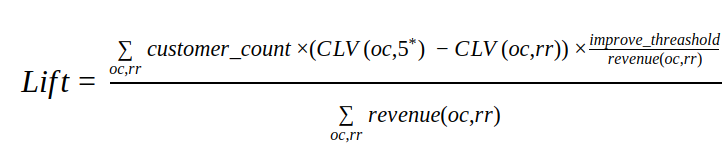
- oc - previous order count
- rr - review rating
- CLV - customer lifetime value
Improve_threashold - rating improvement % wise, e.g. 10%
If we apply the formula above to each cohort when setting improve_threashold as 10%, we get 4.6% revenue lift. Which for a company can give an idea of what is the value of improving customer experience. Finally, let’s see the revenue distributions among our cohorts.
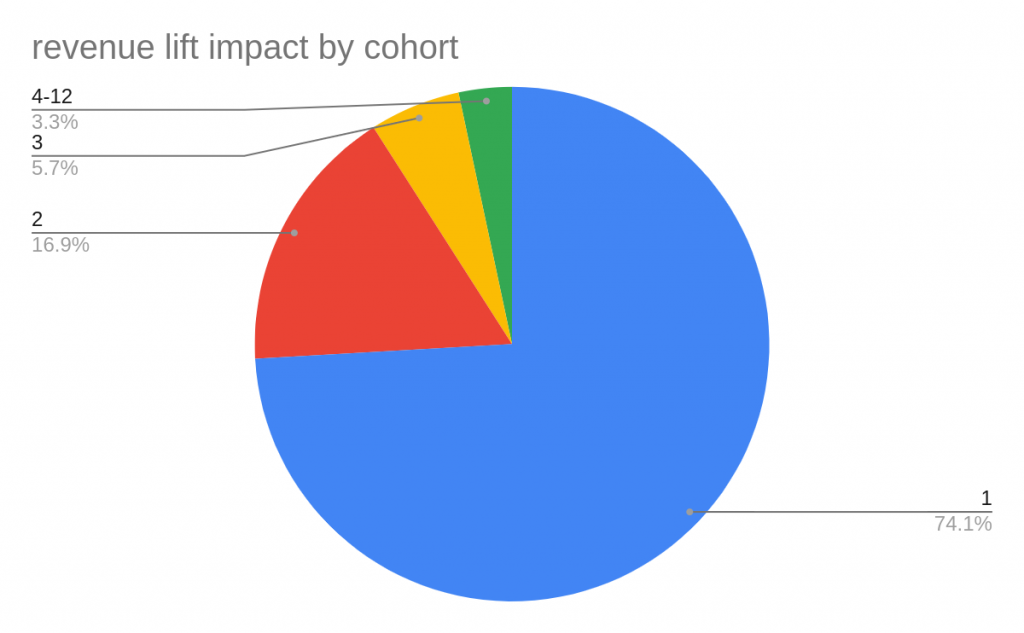
In the pie chart, we can see that rating improvement is likely to impact first-time buyers significantly. Intuitively this makes sense as these customers haven’t done any businesses before with the company. Depending on how they will rate, it is likely to determine if they will buy again. Instead of relying on intuition, it’s always better to see if data prove us right or wrong.
What are the practical applications of customer review data?
There are only a few ways to measure online customer experience - customer reviews so far have proved to be one of the most prevalent. Therefore, it’s crucial for any online business to consistently collect customer reviews, not just to measure the customer experience, but also to improve it. Research suggests that encouraging customers to leave a review is positively correlated with getting higher score reviews.
Once reviews are collected, we can use it to evaluate their effect on the business. The CLV case study we analyzed earlier is part of the analytics toolkit that companies can use. Though reviews can provide more insights like:
- Topic reports - understanding which written topics dominate the customer reviews and how they correlate with the rating.
- Sentiment score reports - view customer sentiment between review and topics using techniques like natural language processing for sentiment analysis.
- Review metric time series graphs - see how each review metric changes overtime to measure if the customer experience is improving for the business.
All of these analytical tools require ownership of data. We can own data by collecting reviews and storing them in business datawarehouse. This does have some challenges that have to be dealt with, as we describe here. On the other hand, if one doesn’t have in-house expertise or resources to deal with the problems above, but still requires the tools mentioned, StackTome is well-positioned to fill this gap.
How can you leverage StackTome for eCommerce review management?
Our solution provides full lifecycle support from review integration to review analytics and review placements on websites. We allow customers to import all review data from the most popular review aggregators.
We can summarize StackTome solution into the following parts:
Data analytics - We provide a dashboard for analyzing base review metrics like average score over time. Each metric is comparable between each source.
Every review we ingest gets a sentiment score, which can be viewed in a chart as well.
For more advanced analytics like CLV relating to reviews, we require customers’ sales data. For this, we provide multiple ways to import it either via CSV, REST API, or by getting directly from eCommerce platforms like Shopify. Once sales data is imported, custom reports can be received on demand.
Reputation management - we allow customers to manage their reputation through customer support channels like Zendesk by responding directly to each review.
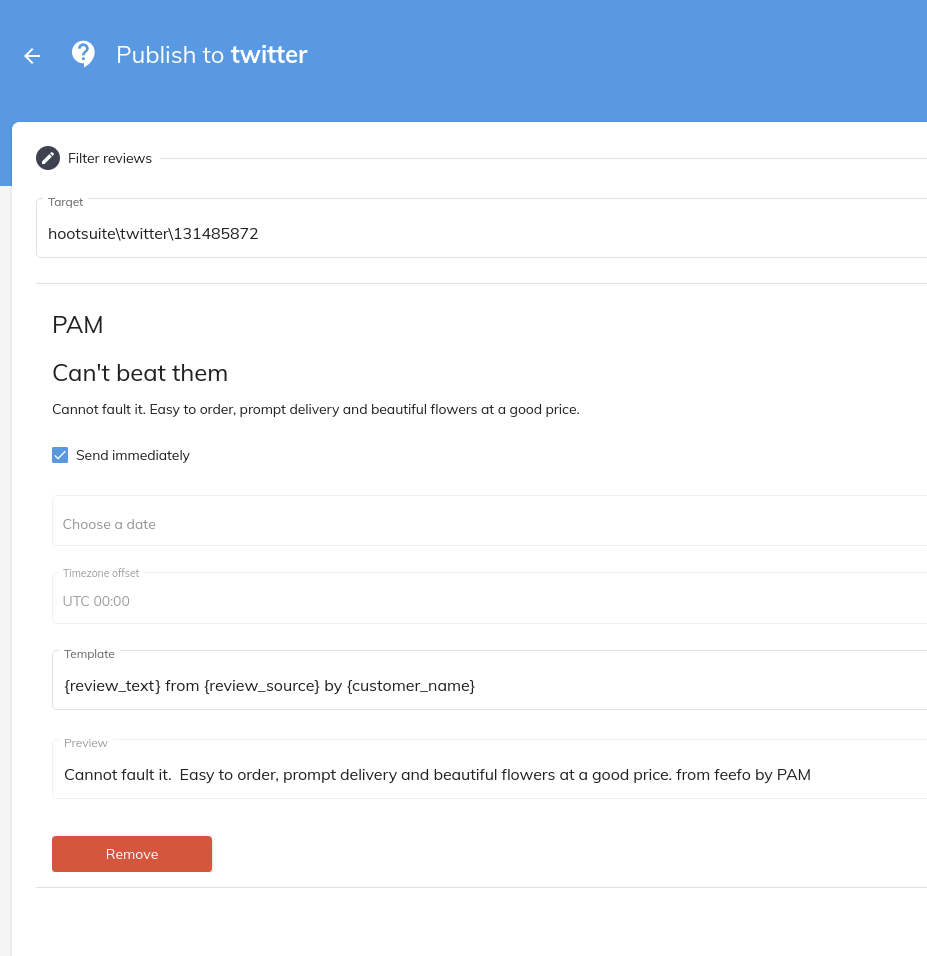
StackTome review app also provides means to automatically publish reviews to any social channel as user-generated content for leveraging the company’s social proof.
SEO - Our solution provides ways of injecting contextually relevant review content on every website page by leveraging our fast REST API or including javascript generated customizable Review widget. Each displayed review is unique to every page and has relevant content but is also updated regularly and automatically as new reviews come in.
Data Ownership - We believe in data ownership as a competitive advantage therefore, all review data that StackTome receives is made available to the cloud datawarehouse of customers’ choice (e.g., Google BigQuery).
For more details on the feature set and how to sign-up for a 14-day free trial, see here.